A couple of years ago, the parents of a dear friend of mine were in the valley. While walking from the Mall road in Manali to the Hadimba temple, they were reminiscing about their time, in fact their honeymoon, almost 35 years ago in Manali. It was overcast and cold, and out walking to the temple from their HPTDC hotel, they craved something hot. On the way was a lone stall selling tea, omelettes and boiled eggs. The hot, piping tea and omelettes were the best of their life.
Come to the present day, and the area around Manali is unrecognizable. Upon entering Manali, you are greeted with hundreds of white taxis, tempos and buses parked on either side, and the dense cluster of hotels in Aleo. Further in, and the cascading rows of hotels in Manali come into view. The boom in tourism is staggering and clearly chaotic.
Besides tourism driving construction of buildings, changing cultural and socioeconomic factors also play a role. Increasing population requires new housing, and an increase in orchards requires labourers who need additional housing. Then someone told me that pretty much everyone from Lahaul has a house in Kullu (mostly for the winter months). On top, as income, people, and tourism grow, they also require commercial establishments, which have sprung up particularly near the national highway.
But something else is needed for the construction to boom in the first place: roads. Building new roads and upgrading existing roads remain the most important topic in any elections. For citizens it remains one of the foremost indicators of development. Roads mean access to the market for their fruits and crops, easier access in case of emergencies, and easier construction of their houses. And even if you talk about how to bring tourism into lesser known valleys, the first answer is roads. I’ve met many aspiring politicians who want to construct roads to meadows inside forests, crossing passes, with views to snow-capped peaks and waterfalls.
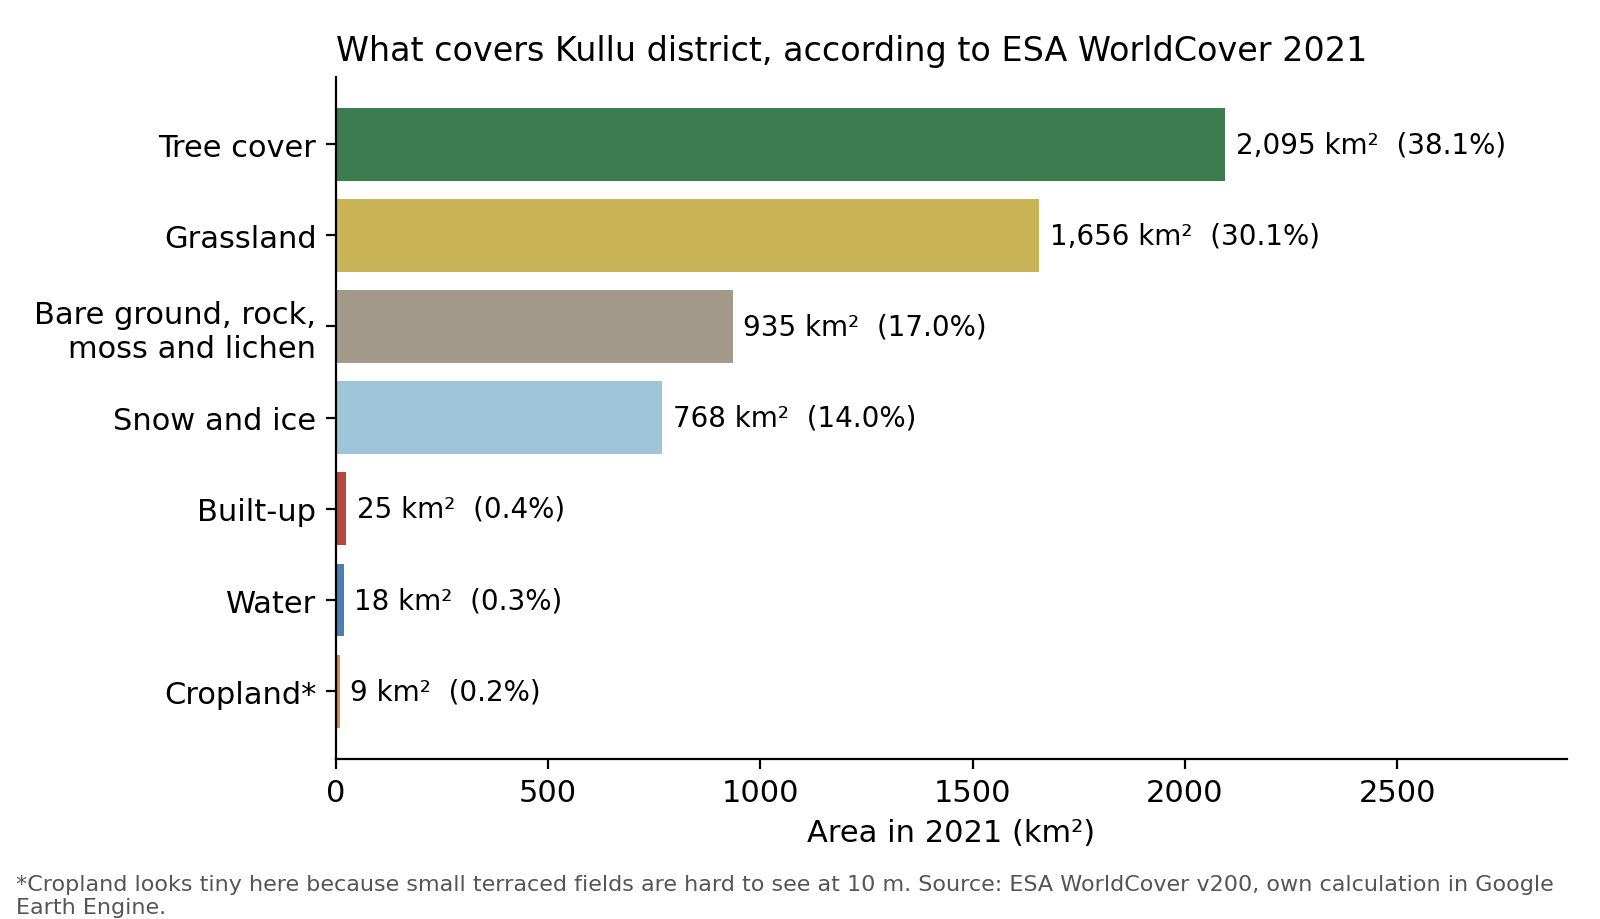
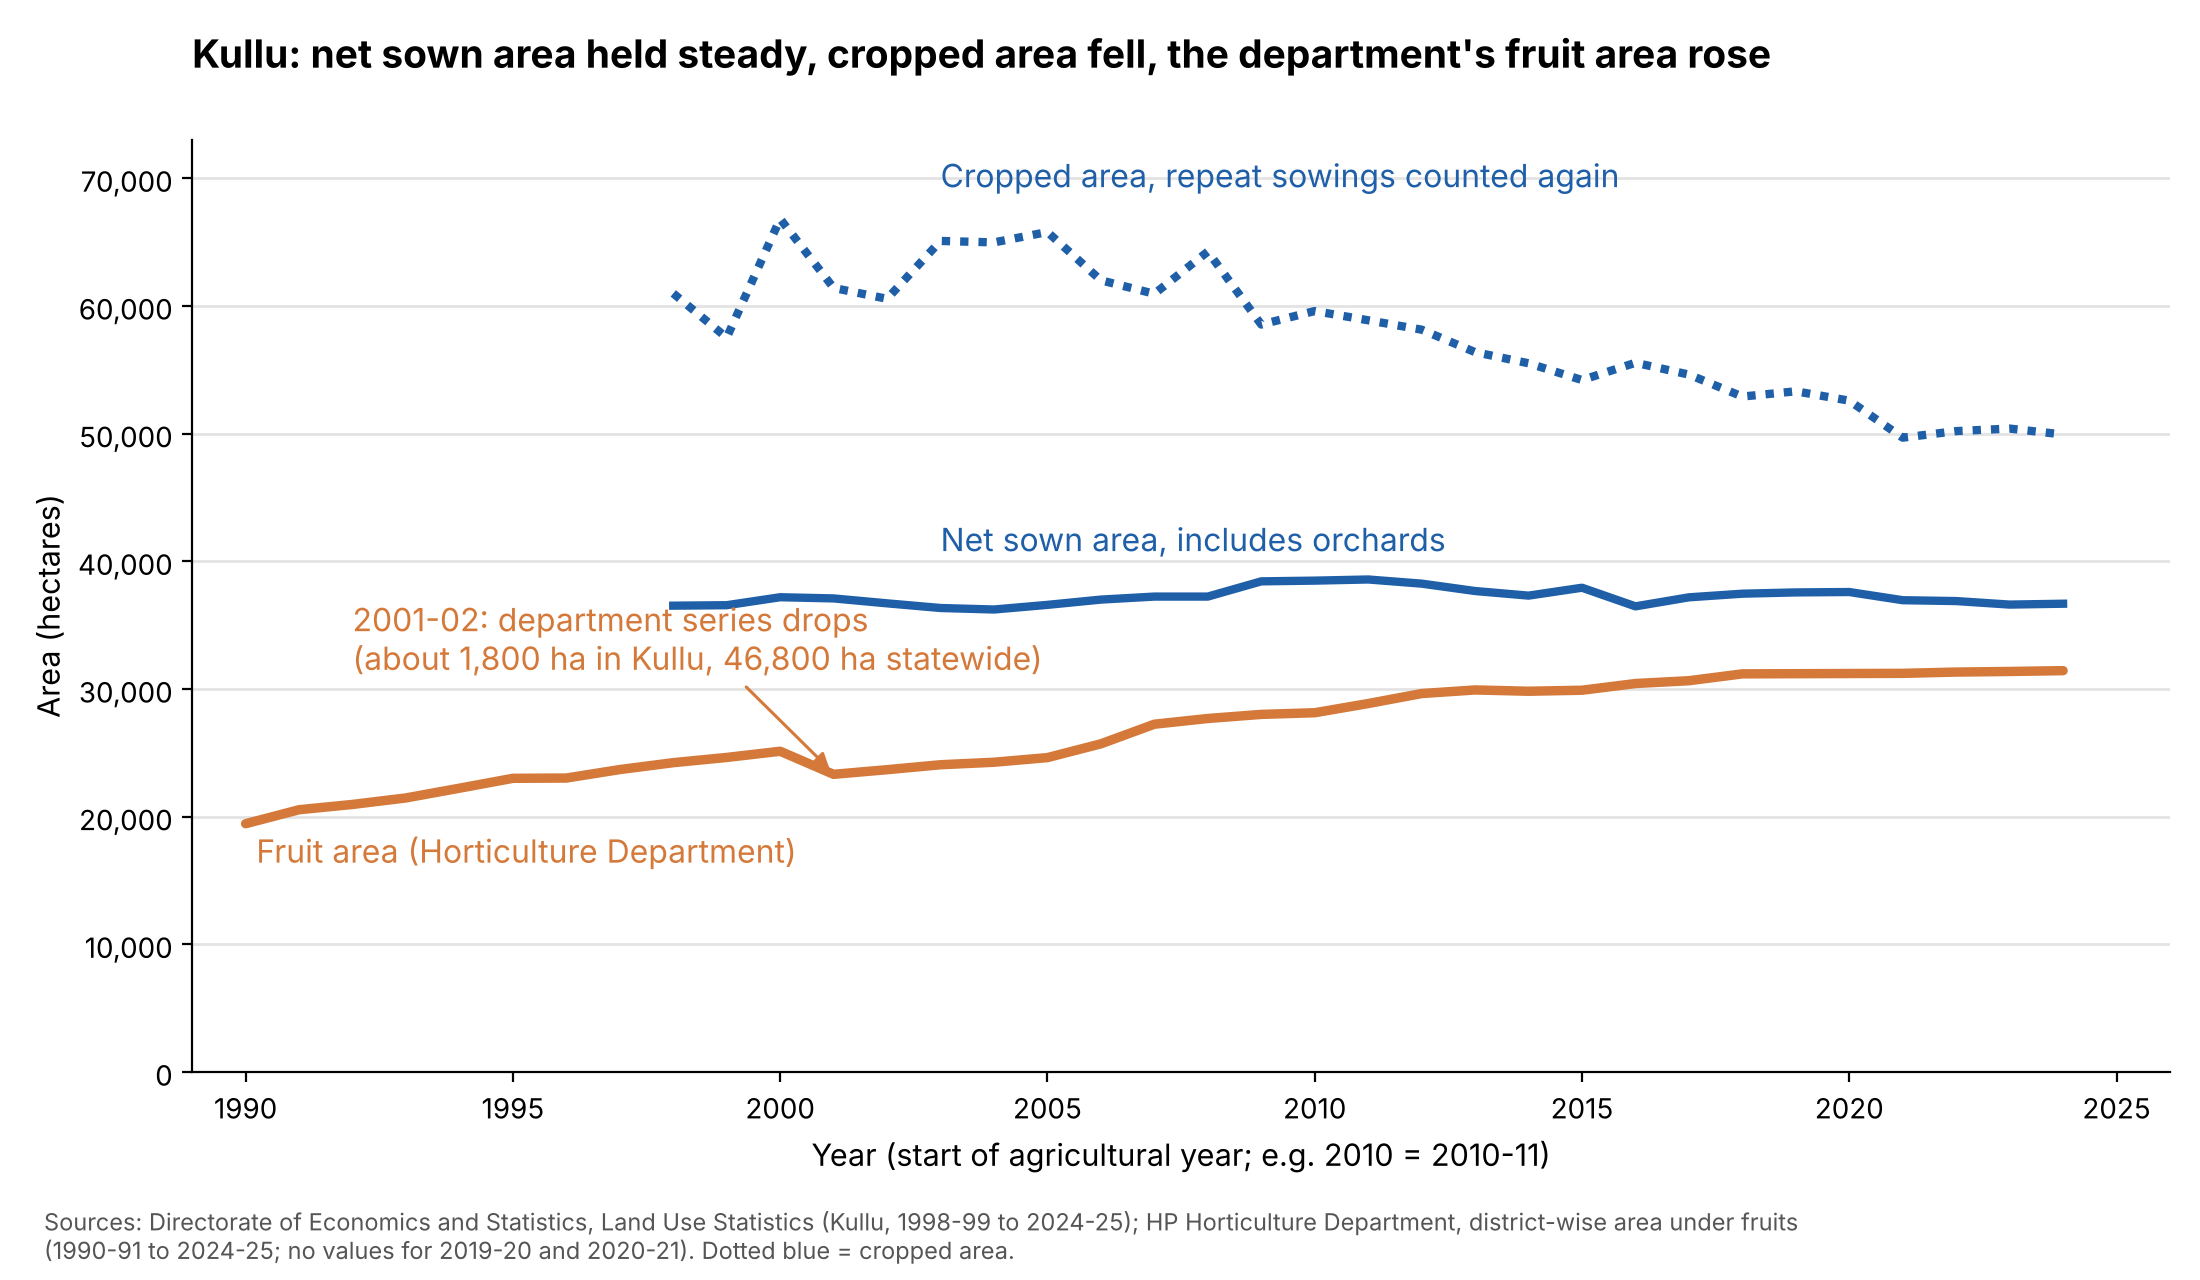
The first post of this series looked at how land is used in Kullu district and how forests are changing. The second then looked at what’s happening to cropland and orchards in the valley. This post looks at built-up area, mainly buildings and roads. Even though it covers a minuscule fraction of the overall area, its impact on the environment and its role in shaping the experience and convenience of people, both residents and tourists, remain important.
This post does four things. First, it works out how much land is under buildings and roads. Second, it looks at how fast that has grown. Third, it shows where most of the addition has happened and, lastly, how much of it sits in a strip along the Beas.
Short version. Buildings in Kullu cover about 1,600 to 2,500 hectares, and roads add about 1,000, so together they cover roughly half a per cent of the district. Building area has more than doubled since 2000 and is still growing, by roughly 3 to 5% a year. Growth is moving away from the main valley: the strip within three kilometres of the Beas held 63% of the district’s building footprint in 2000 and 49% in 2020. The Public Works Department’s tables show road length up about 11% since October 2020. Much of both sits along the Beas: within three kilometres of the river’s centre line are about 43% of the buildings and about a third of the road area, in a strip that is roughly a tenth of the district.
Note that a hectare is a square of 100 metres by 100 metres. Kullu district is about 550,000 hectares.
A few terms come up again and again.
- Building footprint: the ground a building covers, seen from above. A roof counts. The yard around it doesn’t.
- Built-up land: in this post, the land under buildings plus the land under roads.
- Metalled road: a road sealed with bitumen or concrete. An unmetalled road is gravel or earth.
- Motorable road: a road a vehicle can use, from a national highway to a village link road. Footpaths and tracks are left out.
- PWD: the Himachal Pradesh Public Works Department.
- OpenStreetMap (OSM): a free map built by volunteers, including me.
Buildings cover less than half a per cent of the district
Built-up land, as defined above, is the land under buildings plus the land under roads. It tells us where people are concentrated, the size of towns and villages, and how fast they are spreading into land that was something else before.
Similar to what we observed in other posts, here too, there are no official records of land under buildings in Kullu. Data for roads is better, and we will come to that later. The land-use statistics have a class for non-agricultural uses, but as far as I can tell it lumps houses with roads, water and other uses, so it doesn’t directly answer the question. To add to the problem, reported area from the revenue department has grown over time, so it’s hard to know how much of the change is real and how much comes from increasing land under records.
Coming to our aid are satellites. These offer two kinds of product. The first draws an outline around each building. Examples of this include Google’s Open Buildings [3] and Microsoft’s Building Footprints [5], and the total area of the outlines is the footprint. The second sorts land into classes. The Global Human Settlement Layer (GHSL) [1] estimates how much of each 100-metre square is covered by buildings, and ESA WorldCover [2] gives each 10-metre pixel one class, such as “built-up”. A 100-metre square can’t see a house, and a land-cover class tends to take in the yard and the access path with the house, because it works in contiguous patches.
For the absolute number I trust the outline products more, since they trace individual roofs. Since the datasets of building outlines are more recent and only good for snapshots, I still need to rely on other datasets to understand change.
Figure 1 puts them side by side.
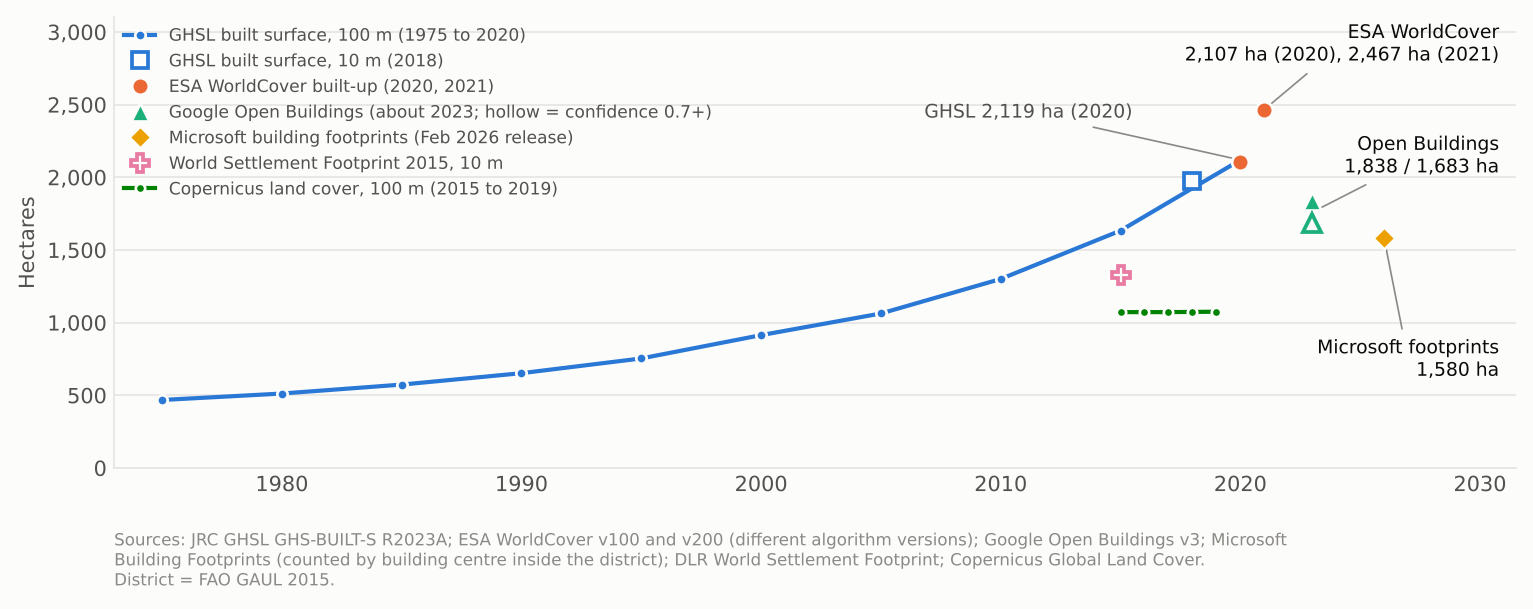
Around 2020 the main products sit between about 1,600 and 2,500 hectares. The products that trace outlines, Google’s Open Buildings and Microsoft’s Building Footprints, come in lower. The ones that classify land, the GHSL and ESA WorldCover, come in higher. Within Open Buildings the number depends on how sure the model must be before it counts a detection. WorldCover’s values for 2020 and 2021 come from different versions of its algorithm, so the difference between them isn’t a real change. The older, coarser World Settlement Footprint 2015 [6] and Copernicus land cover [7] come in lower still. Microsoft’s file is named for its February 2026 release, which is the date it was published and not the date of the imagery behind it, so it may not belong to 2020 exactly.
Thus, using the first approach, tracing outlines, gives between 1,580 and 1,838 hectares of built-up area. The second, classifying land, sits higher, between 2,100 and 2,467. I trust the first more for the absolute number, but the second is a useful upper bound. Across both, roughly 0.3 to 0.45% of the district’s area is under buildings.
Building area has more than doubled since 2000
The GHSL runs longest, from 1975 to 2020, so it carries the long trend. It finds 468 hectares of buildings in 1975, 914 in 2000 and 2,119 in 2020. That is about 4.5 times the 1975 area and 2.3 times the 2000 area. Between 2010 and 2020 alone the area grew by 63%.
The left panel of Figure 2 shows growth in each five-year period. Each period beats the one before it, except 2000 to 2005. In the five years to 2020 the area grew by 30%, about 5% a year.
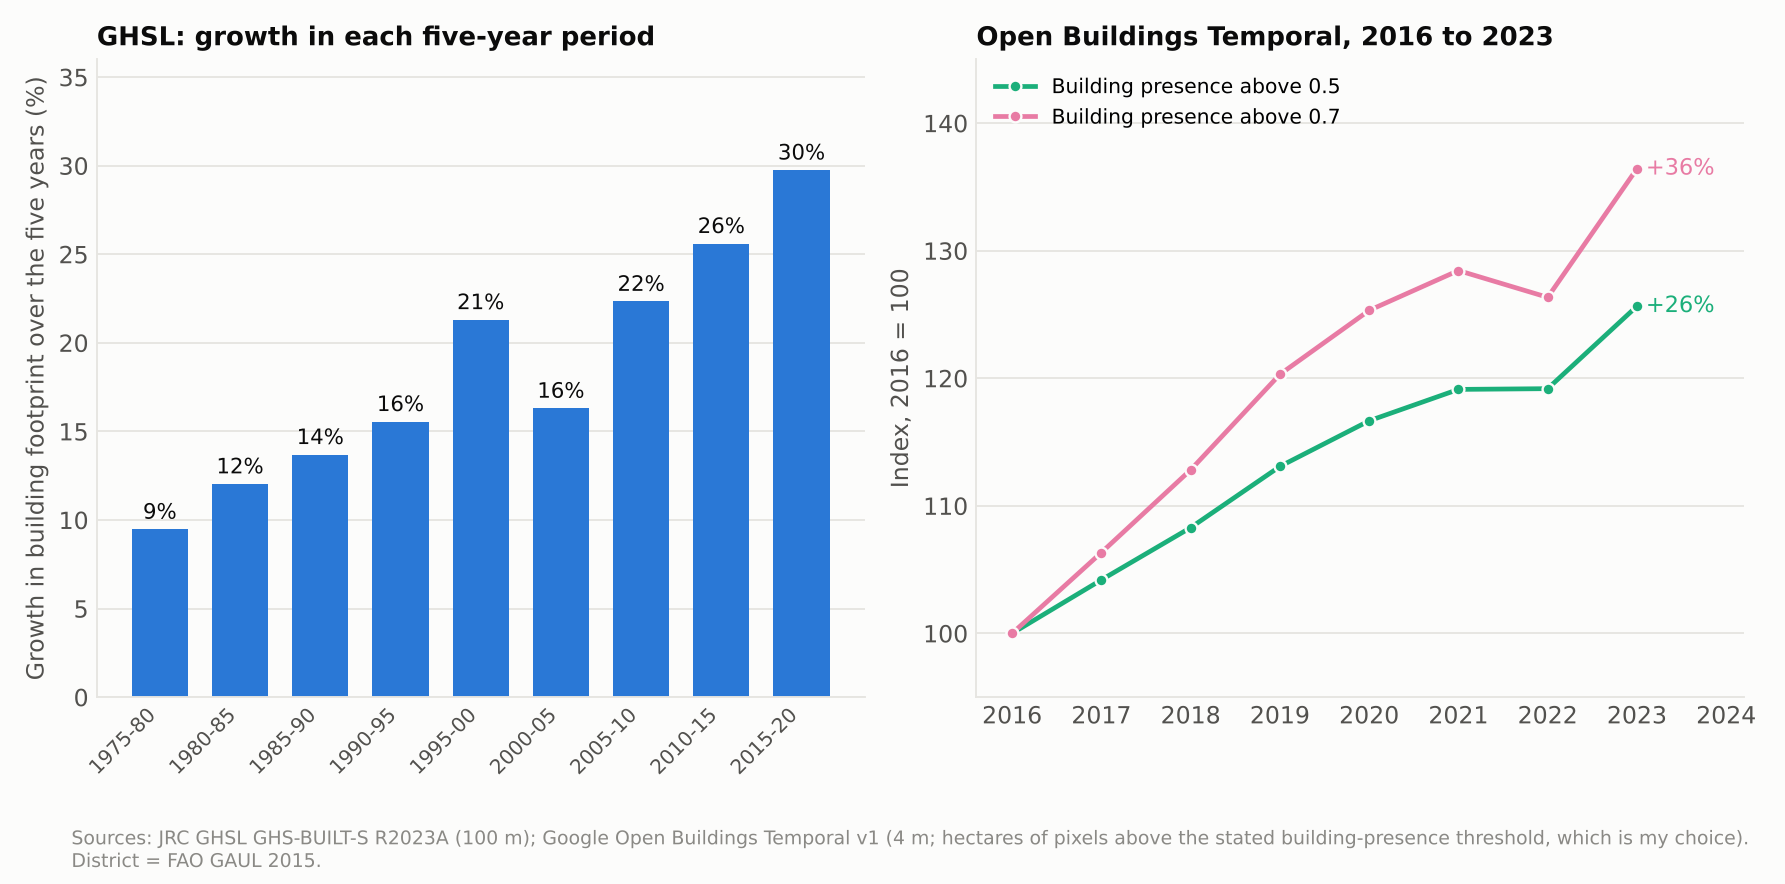
At shorter time intervals, Google’s Open Buildings Temporal [4] gives a yearly series from 2016 to 2023 at 4 metres. It is a different product from the Open Buildings outlines used above: a yearly raster at 4 metres, not an outline of each roof, and so its totals don’t match the outline total. It rises by about 26% to 36% over the seven years, or about 3.3 to 4.5% a year, depending on what threshold I enter for the building-presence score, i.e., how loose the detection is. Both thresholds rise steadily to 2020, flatten in 2021 and 2022, and jump in 2023. The flattening in 2021 and 2022 might be because of Covid, with recovery in 2023.
Taken together, the sources suggest growth of roughly 3 to 5% a year in recent years in built-up area. The rate of building increase has indeed been staggering.
The growth is spread through the valleys, not only Manali and Kullu
Figure 3 shows the GHSL on a 500-metre grid. The left map shows where the buildings were in 2020, and the right map shows where they were added between 2000 and 2020.
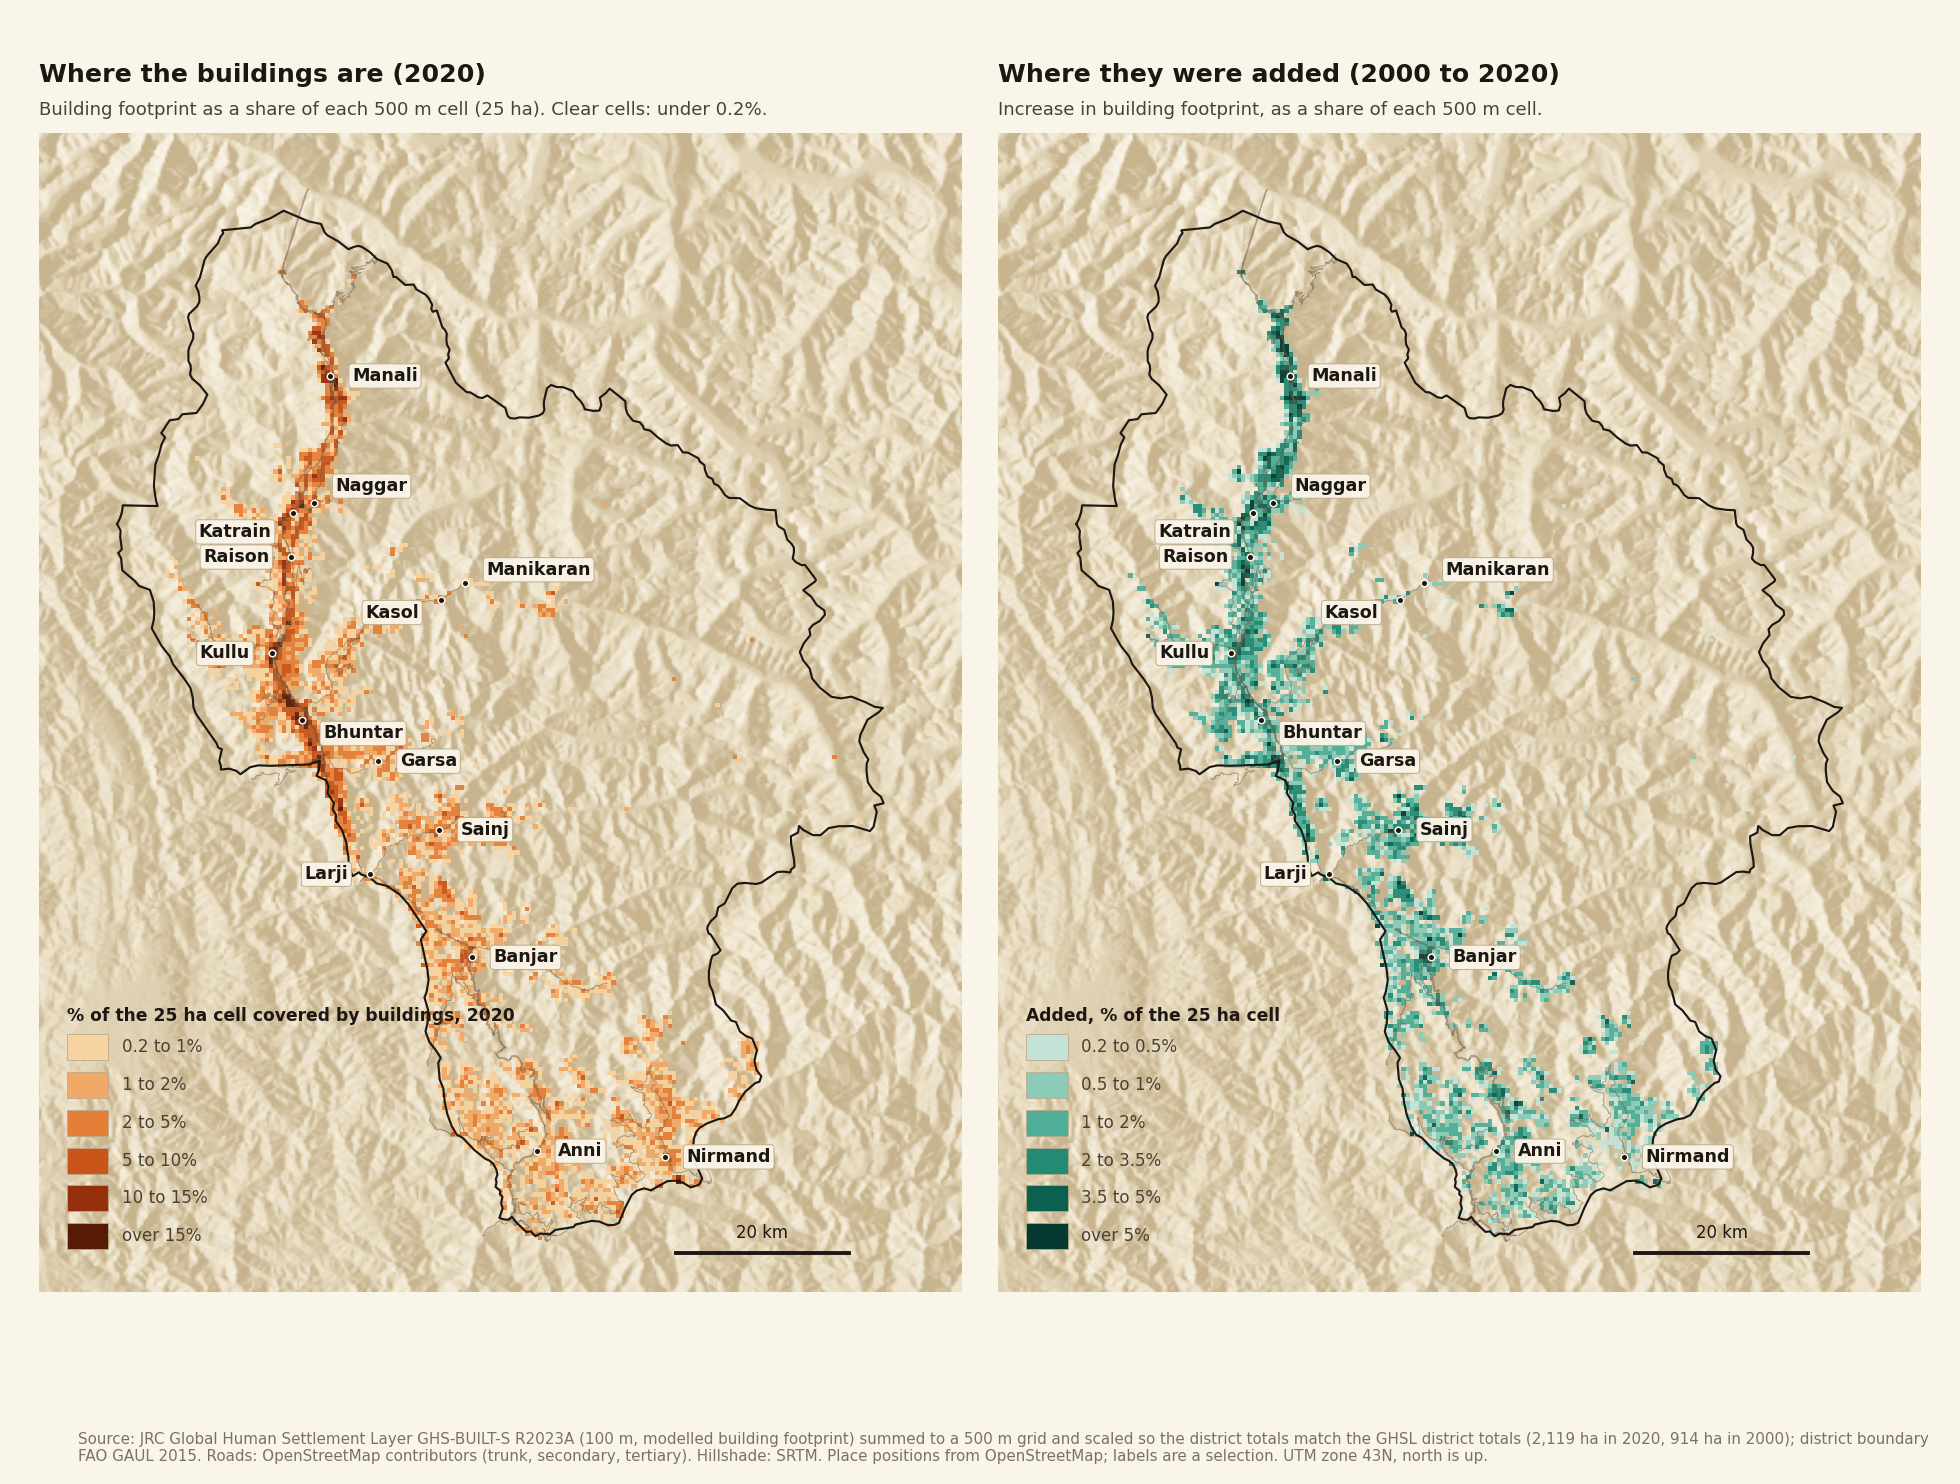
Two things stand out. First, the buildings follow the rivers. The long dark band runs down the Beas valley from Manali through Naggar, Katrain, Kullu and Bhuntar. The Sainj, Tirthan and Parvati valleys carry thinner lines, and the south of the district, around Anni and Nirmand, is a scatter of light squares. Second, a small number of squares hold much of the built area. The 200 squares with the most buildings hold 26% of the district’s built area. The top 400 hold 39% and the top 800 hold 56%, out of about 22,000 squares.
Where did the growth go? I assigned each square to the nearest of ten named areas, if its centre is within three kilometres, and added up the area in 2000 and 2020. The areas are my choice, so Table 1 is a rough guide.
| Area | Built area in 2000 (ha) | Built area in 2020 (ha) | Times larger | Share of the district's growth |
|---|---|---|---|---|
| Naggar to Katrain (with Sarsai, Rumsu, Patlikuhal) | 71 | 165 | 2.3 | 7.8% |
| Manali area (Manali, Vashisht, Prini) | 67 | 154 | 2.3 | 7.2% |
| Bhuntar and Bajaura | 174 | 237 | 1.4 | 5.3% |
| Banjar, Gushaini, Jibhi (Tirthan valley) | 15 | 78 | 5.1 | 5.2% |
| Sainj and Larji | 13 | 60 | 4.5 | 3.9% |
| Kullu town (Kullu, Dhalpur) | 82 | 126 | 1.5 | 3.6% |
| Raison | 27 | 66 | 2.4 | 3.2% |
| Anni and Nirmand (Outer Seraj) | 44 | 75 | 1.7 | 2.5% |
| Garsa | 12 | 37 | 3.1 | 2.1% |
| Parvati valley (Manikaran, Kasol, Jari) | 11 | 29 | 2.6 | 1.5% |
| Everywhere else | 398 | 1,092 | 2.7 | 57.6% |
Table 1. Building footprint by named area, from the GHSL on a 500 m grid [1]. The hectares are sums of whole 500 m squares, scaled so that they add up to the district totals (2,119 hectares in 2020 and 914 in 2000).
Growth was uneven. Kullu town and Bhuntar were already built up in 2000, and they grew the least in proportion, by about 1.4 to 1.5 times. Manali and the Naggar to Katrain stretch grew about 2.3 times. The places that grew most in proportion started small. The Tirthan valley around Banjar grew about five times, and Sainj and Larji about four and a half times, though each added only about 45 to 60 hectares.
The larger point is the last row. The ten named areas together hold about 42% of the district’s growth. The other 58% is spread over hundreds of squares that I didn’t name: 1,260 of them gained at least 0.2 hectares. The growth is spread through the valleys, not only through Manali and Kullu. Note that GHSL has a 100 m resolution, which means it is good at detecting change in building clusters but not individual houses constructed far from clusters.
Table 2 splits the district a second way, into three parts that don’t overlap. The first is the Beas corridor, which is every square with its centre within three kilometres of the river’s centre line. The second is the side-valley areas from Table 1: Tirthan, Sainj and Larji, Parvati, Garsa, and Anni and Nirmand (Outer Seraj). The third is everywhere else. A square inside the corridor counts as corridor even if it also belongs to a named area, which moves 40 squares of the Sainj and Larji and Garsa areas into the corridor.
| Area | Built area in 2000 (ha) | Built area in 2020 (ha) | Times larger | Share of the district's growth |
|---|---|---|---|---|
| Beas corridor (within 3 km of the main river) | 573 | 1,045 | 1.8 | 39.2% |
| Side-valley areas (Tirthan, Sainj and Larji, Parvati, Garsa, Outer Seraj) | 91 | 269 | 3.0 | 14.8% |
| Everywhere else | 250 | 805 | 3.2 | 46.1% |
Table 2. Building footprint in 2000 and 2020 by part of the district, from the GHSL on a 500 m grid [1], scaled to the district totals as in Table 1. The corridor is measured from the main river only, using the centre line from OpenStreetMap [10]. The shares of growth add up to 100% before rounding.
The Beas corridor held 63% of the district’s building footprint in 2000 and 49% in 2020. It took 39% of the growth, and its built area grew 1.8 times, against 3.0 times in the side valleys and 3.2 times everywhere else. That 49% is close to the 47% of footprint that Google’s Open Buildings puts within 3 kilometres of the river (Figure 6), so the two datasets agree on how much sits in the corridor.
Kullu has about 216 kilometres more road than it had in October 2020
Now onto roads and, luckily, roads have a better official record than buildings. The Public Works Department publishes a district table of metalled and unmetalled road length. It overwrites its page each year, so I recovered older versions from the Internet Archive’s Wayback Machine [8]. I found versions for 31 October 2020 and 31 March 2024, and I read the 2026 version from the live page.
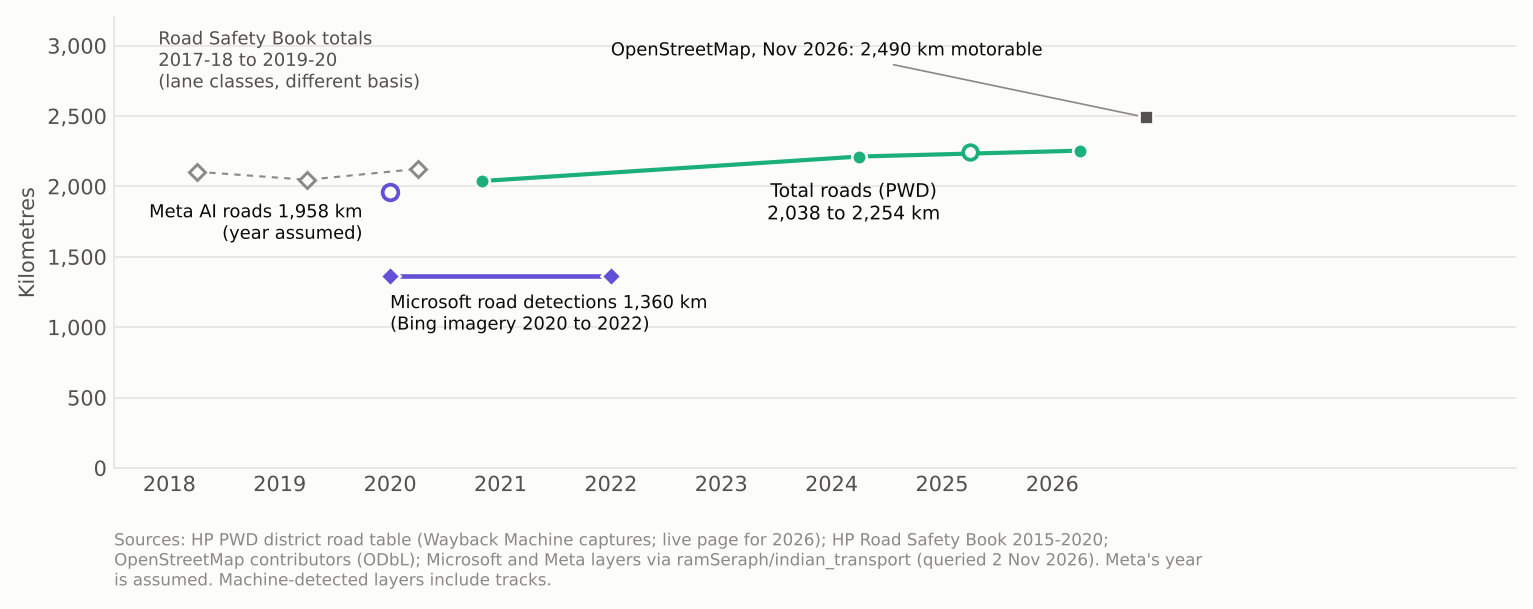
According to the PWD, as of 31 March 2026, there are 2,254 kilometres of road in Kullu, and in October 2020 it was 2,038. Total length thus rose by about 216 kilometres, or 11%, in about five and a half years, roughly 40 kilometres a year.
The other datasets give no time series. OpenStreetMap has about 2,490 kilometres of motorable road in the district, plus about 1,750 kilometres of footpaths and trails and about 260 of tracks that I left out.
Buildings and roads together cover about half a per cent of the district
To find the area occupied by roads, I need the road length. OSM carries the road width for some of the roads. For roads classified as “unclassified” on OSM (these are often rural or link roads), I looked them up on Google Earth and measured their width. The national highway is four-lane in certain sections and two-lane in others. Secondary and tertiary roads generally easily allow two vehicles to pass. I assume 8 metres for the national highway, 6.5 for secondary roads, 5.5 for tertiary roads, 3 for the rural link roads that OpenStreetMap calls unclassified, and 3 for residential and service roads as well. These widths are assumptions, and Figure 5 shows a low and a high estimate for each class.
These widths cover the road surface and its shoulder only.
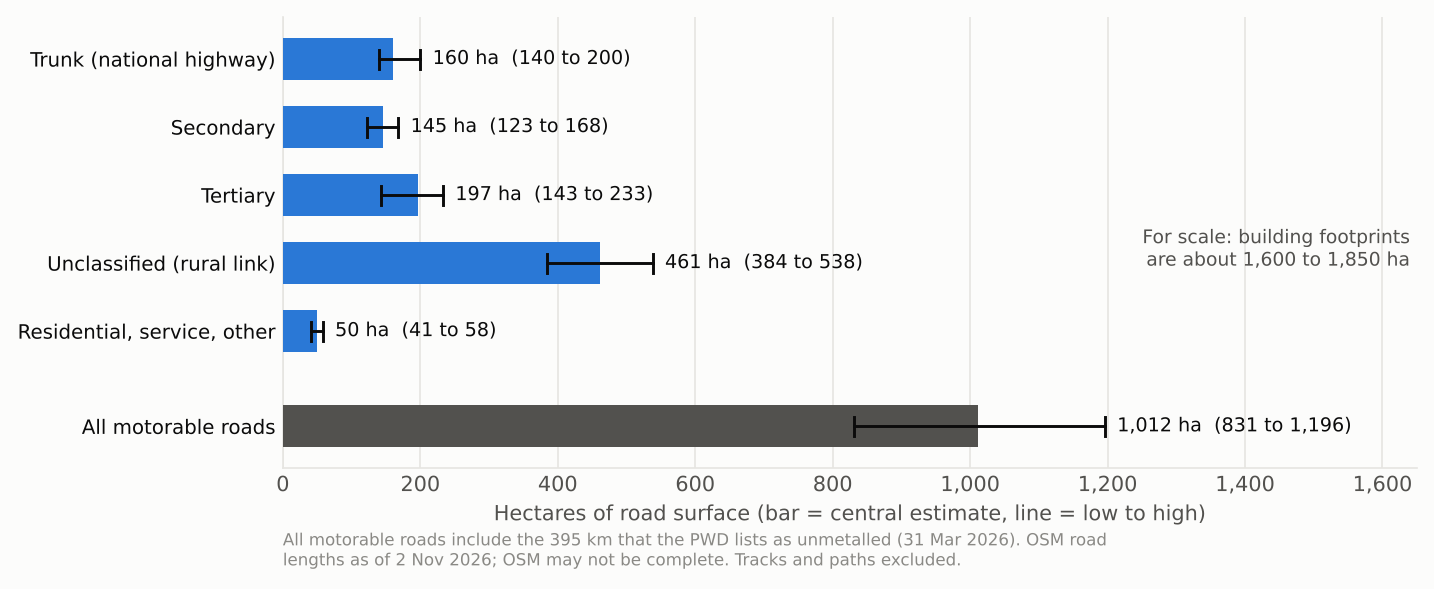
The answer is about 1,010 hectares, or between about 830 and 1,200 with the low and high widths. The rural link roads are 46% of it, about 460 hectares, because there are so many of them. The national highway is about 200 kilometres long and covers about 160 hectares. Even if the whole highway were four-lane, at about 15 metres, it would cover about 300 hectares, and the total would rise to about 1,150, still inside the high estimate.
Treat the 1,000 hectares as a minimum, though. In the hills a road takes far more land than its surface: the slope cut above it, the retaining walls, and the debris dumped below. None of that is counted here.
Thus, adding the roads to the buildings gives about 2,600 to 2,850 hectares using the outline datasets and about 3,100 to 3,500 using the classified datasets. That is roughly 0.5 to 0.6% of the total district area.
A strip about a tenth of the district holds 43% of the buildings
The Beas runs the length of the valley, about 92 kilometres of main river inside the district, from the head of the valley above Manali to Larji. I took its centre line from OpenStreetMap [10] and measured how much of everything lies within 500 metres, 1 kilometre and so on up to 3 kilometres. For buildings I used Google’s Open Buildings [3], keeping detections with a confidence of 0.7 or more, which gives about 205,000 buildings and 1,683 hectares. For roads I clipped the OpenStreetMap lines at each distance and added up the length, and I used the road-area estimate from Figure 5.
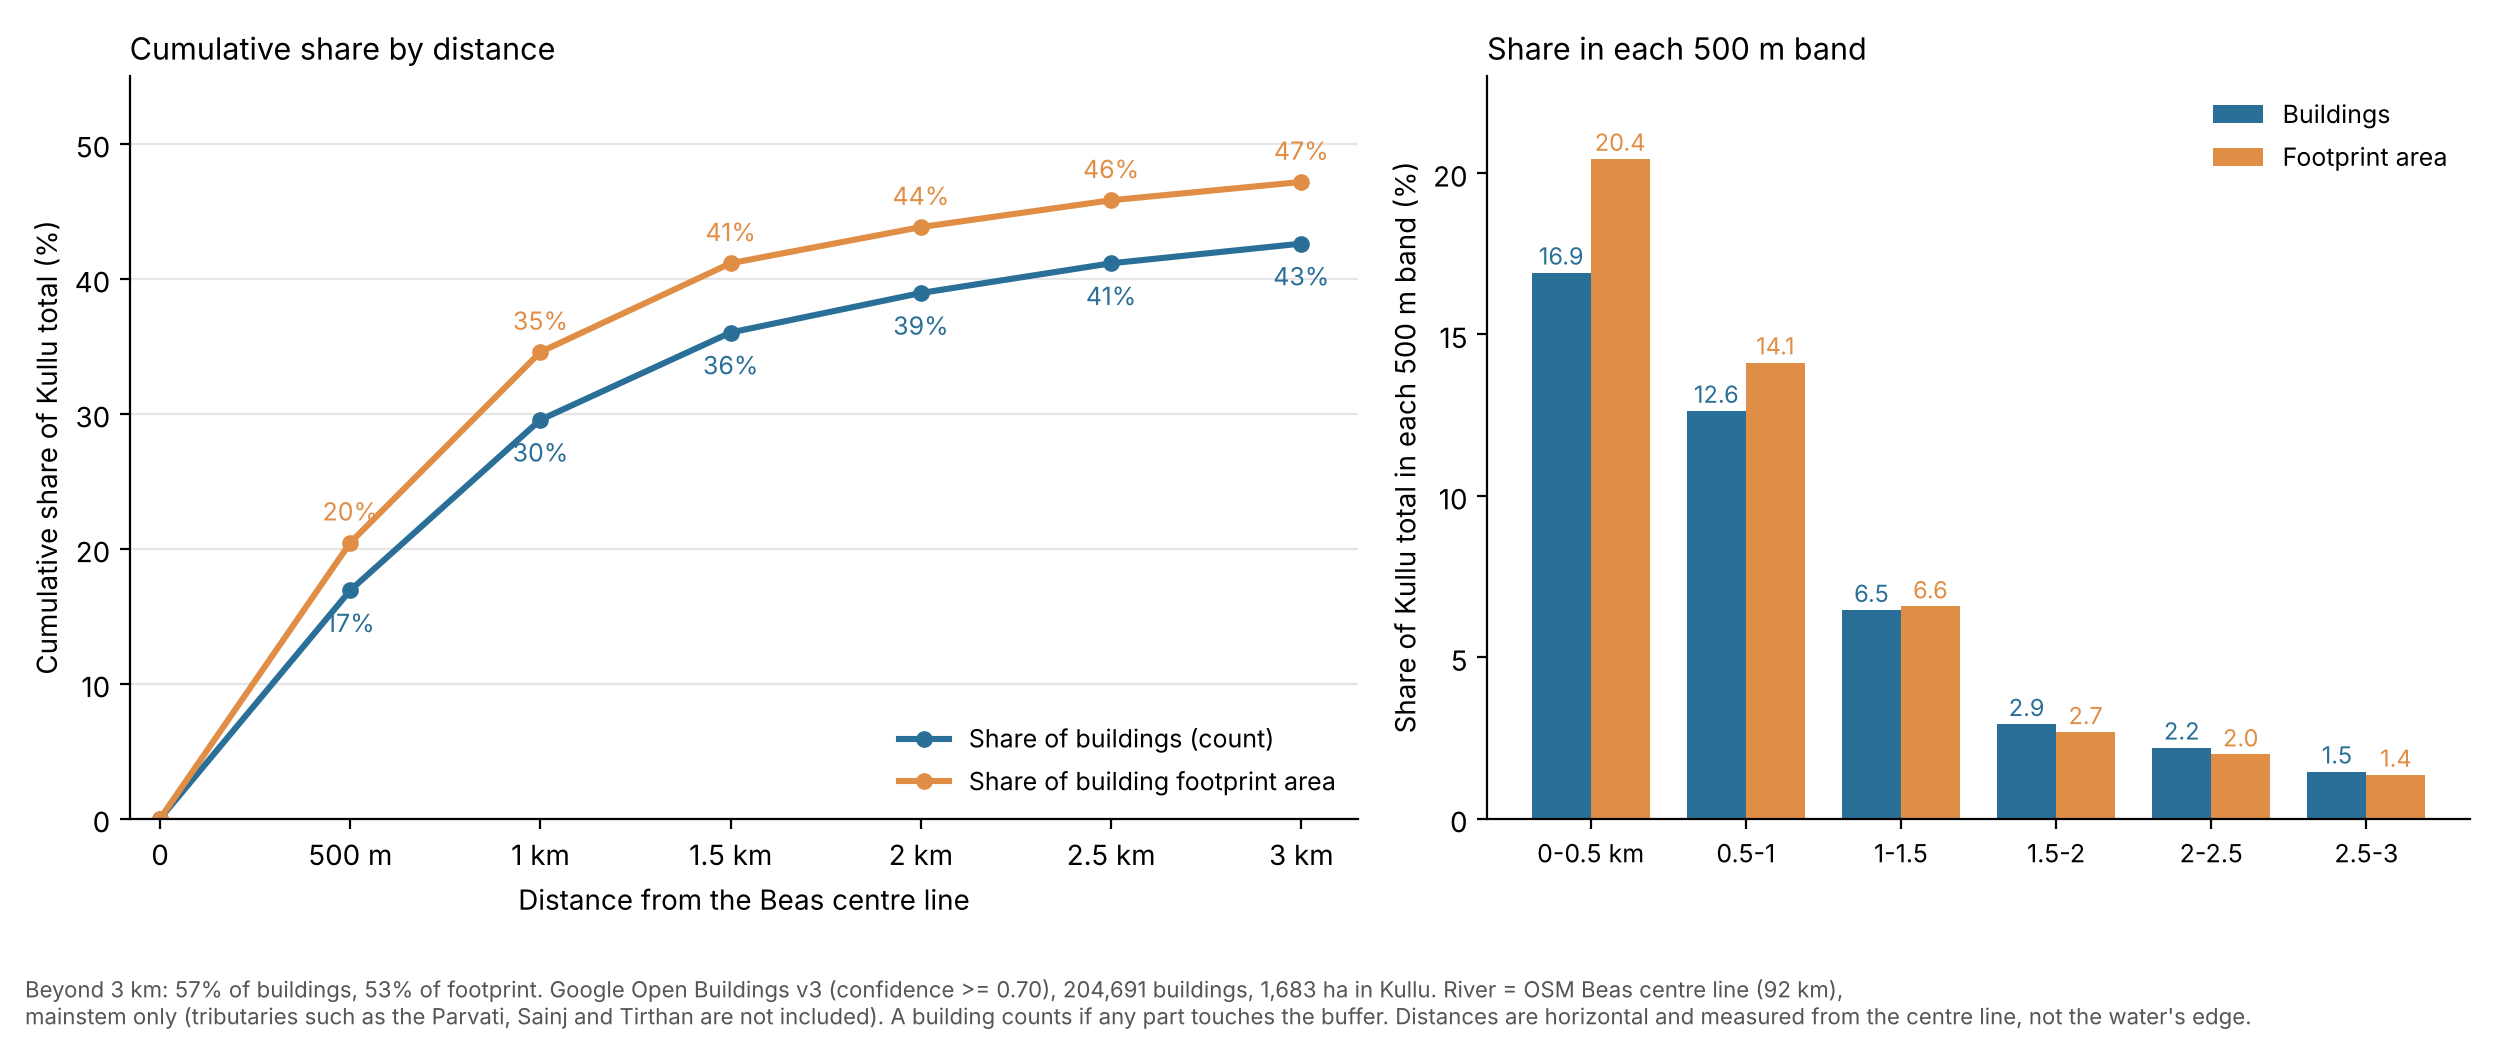
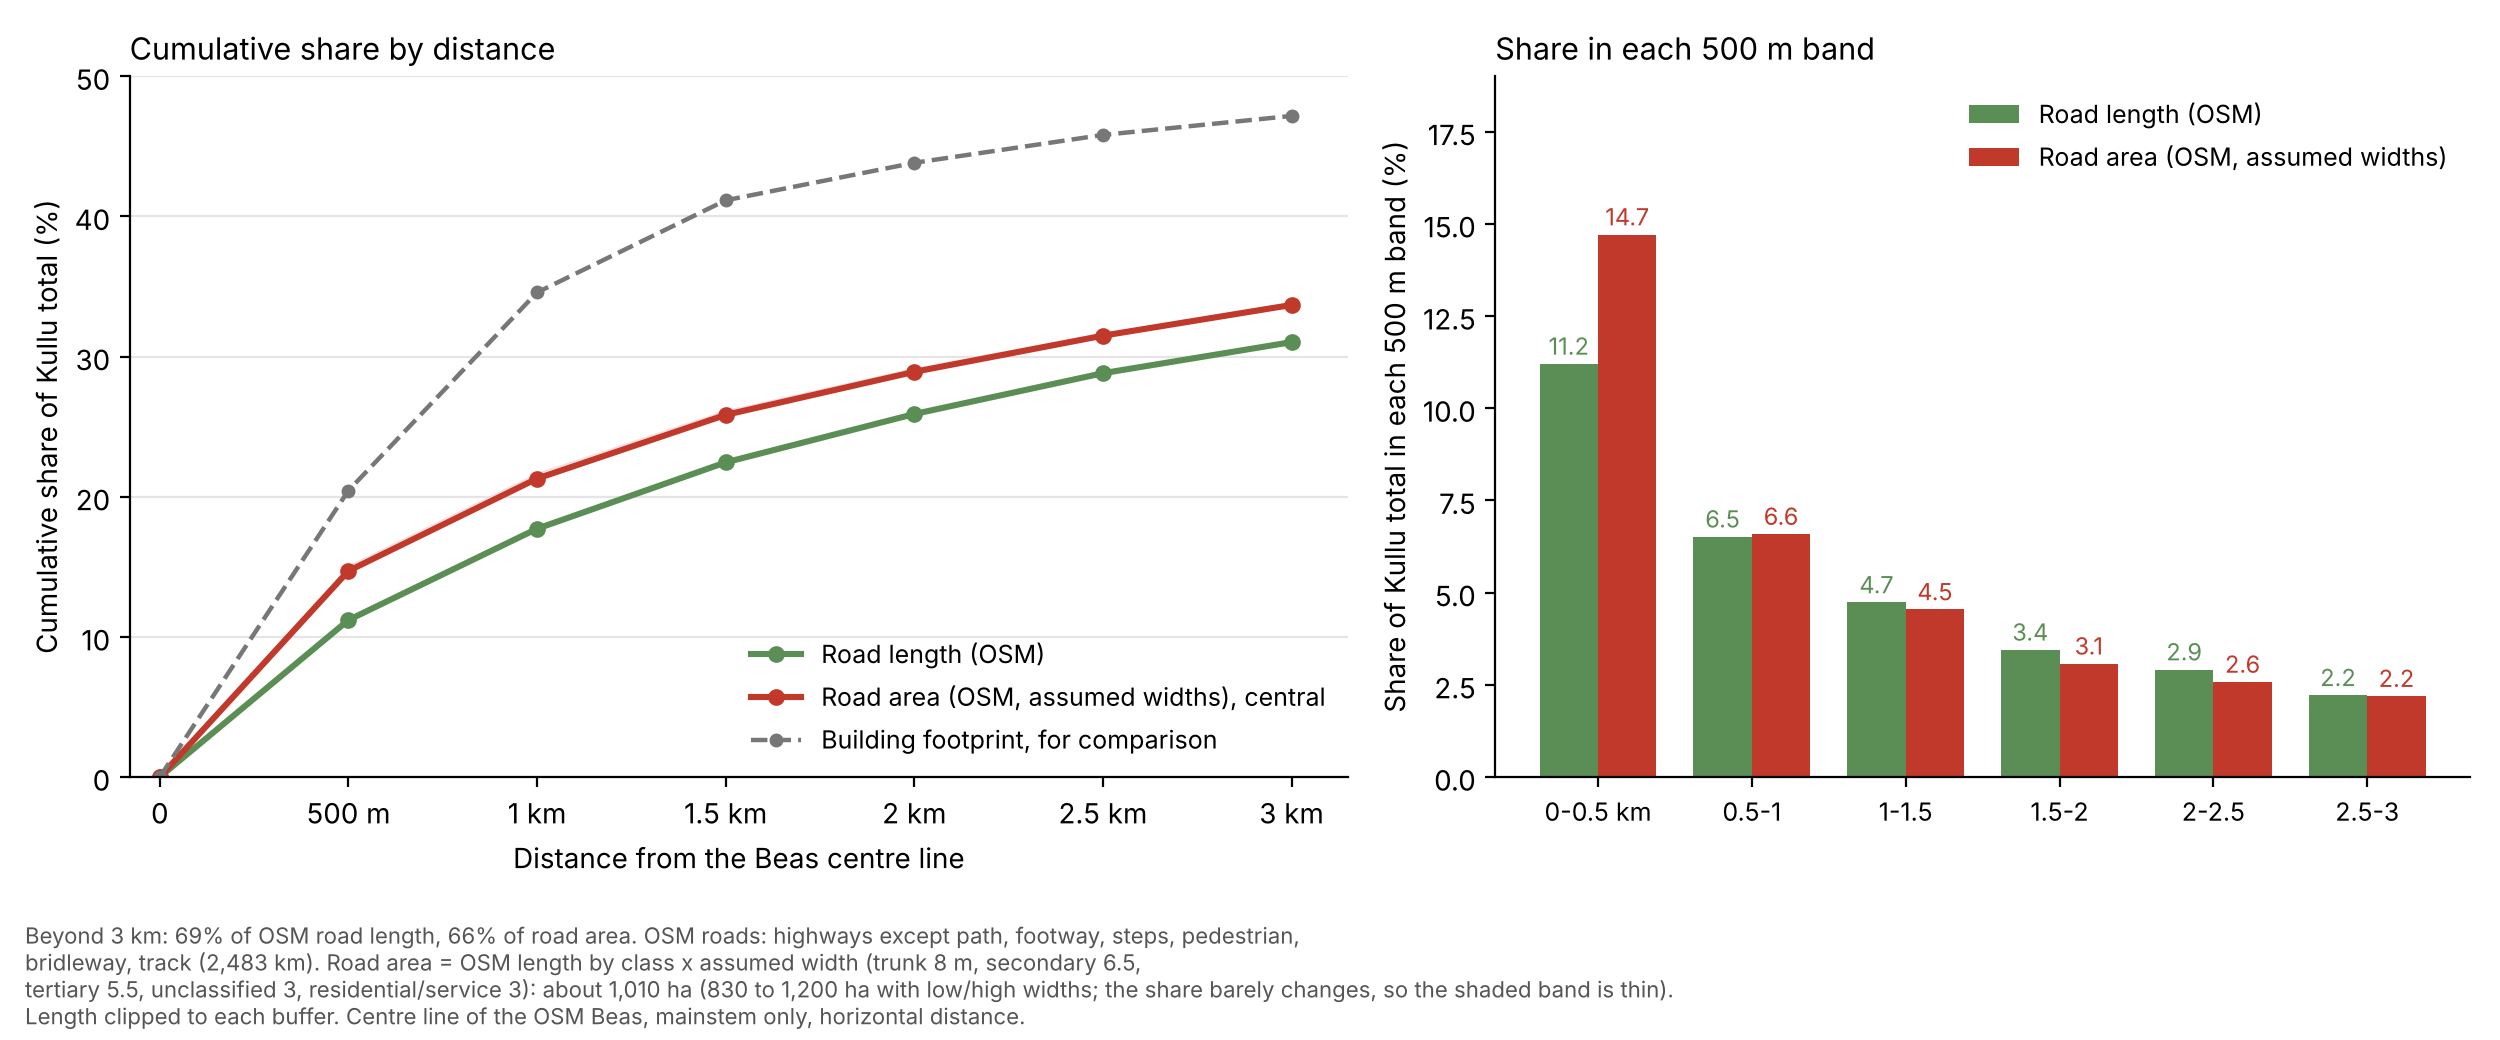
Within 500 metres of the centre line sit 17% of Kullu district’s buildings and 20% of its building footprint. Within a kilometre it’s 30% and 35%, and within 3 kilometres it’s 43% and 47%. The footprint share is higher than the share by number, so the buildings near the river are on average bigger than the ones further away. I’d guess hotels and shops.
Roads crowd towards the river less than buildings do. Within 500 metres sit 11% of the road length, and within 3 kilometres 31%. Road area is more concentrated than road length in the first 500 metres, 15% against 11%, because the national highway runs along the valley floor and is the widest road in the district. Beyond about a kilometre, the link roads dominate; they’re narrow, and the area share drops below the length share.
For scale, a strip of 1 kilometre on either side of the river is about 3% of the district’s area, and a strip of 3 kilometres on either side is about a tenth. Those are my rough estimates, the river’s length times the strip’s width, and I didn’t clip them to the district boundary. So about 43% of the buildings, and about a third of the road area, sit on about a tenth of the land.
Note that this data covers only the main river Beas. Its tributaries, the Parvati, Sainj and Tirthan, which also carry a lot of settlement but have lower, flatter areas, aren’t in it.
This matters beyond counting. The strip along the Beas is also the part most exposed to floods. After the heavy rain of 9 and 10 July 2023, the Beas damaged highways and other roads across Kullu district, and the stretch between Kullu and Manali was hit hardest [12]. At Raison, about a kilometre of the national highway was completely damaged and nothing was left of the four-lane road [12]. Houses built along the banks from Manali up to Aut were damaged too [13]. A study of the Beas between Manali and Mandi after the flood found that the surfaces closest to the riverbed and to the tributary channels suffered the most damage [14]. So the buildings and roads packed along the river are also the ones most exposed to the next flood.
What I Take From This
Unlike in the previous post, where data was scant and often went in opposite directions, the data on built area is much better.
- Buildings cover about 1,600 to 2,500 hectares, roads about 1,000, together about half a per cent of the district. The lower end of the building range comes from the outline datasets and the upper end from the land-classification datasets, the GHSL and WorldCover. The road length comes from OSM and the PWD. The road width rests on assumptions.
- Building area has more than doubled since 2000 and is still growing, at roughly 3 to 5% a year. The sources disagree about the exact pace, but none of them shows growth stopping.
- The growth is moving away from the main valley. In 2000 the Beas corridor held 63% of the district’s building footprint; by 2020 it held 49%, and it took only 39% of the growth in between. Kullu town and Bhuntar grew least in proportion, while the side valleys, Tirthan and Sainj and Larji above all, grew three to five times from small bases.
- Road length is up by about 11% since October 2020. The PWD tables show 216 kilometres of net gain, about 40 kilometres a year.
- Much of it sits along the Beas. About 43% of the buildings and a third of the road area lie within 3 kilometres of its centre line. This finding shows that any policy related to buildings needs to first and foremost target villages and towns close to the river.
Manali is where the change is easiest to see, and it’s where my friend’s parents found their tea stall. But in proportion it isn’t where building has grown fastest. That’s the Tirthan and Sainj valleys, which started small and have grown four to five times since 2000. I’d guess homestays and the roads that opened those valleys up have a lot to do with it.
What’s Next
To say where the land came from, I need land-use maps from an earlier date to lay under the building maps. The only NRSC data that is freely available is the 1:50,000 maps for 2005-06, 2011-12 and 2015-16, and these give overall numbers, not gridded maps, so they can’t be laid under the building maps. NRSC’s 1:10,000 and 1:250,000 maps, which go back further and, in the case of the 1:10,000 maps, are more detailed, need approval from Bhuvan, ISRO’s online map portal. The roads need their own post, on how much road is likely to be added. It starts from the rural road schemes still under way and from how far the buildings sit from the nearest road. After that come snow and ice, then grassland.
Data and methods
The details behind a few of the numbers above.
Building footprint on a 500-metre grid
The GHSL gives building footprint on a 100-metre grid for 1975 to 2020 [1]. For the maps and Table 1, I added the 100-metre squares up into 500-metre squares for 2000 and 2020. The squares added up to about 2.3% more than the district total in 2020 (about 2,168 hectares against 2,119), probably because squares along the boundary are counted whole. I scaled every square down by the same factor so that the squares add up to the district totals, 2,119.1 hectares in 2020 and 913.9 in 2000.
For the named areas, I assigned each square to the nearest of ten places (a town or a group of villages, with positions from OpenStreetMap [10]) if the square’s centre is within three kilometres of it, and to “Everywhere else” if not. The villages behind each area are in the first column of Table 1. The rule gave the same area as my earlier assignment on a 1 km grid for 99.97% of squares.
For Table 2, I took the five ways that OpenStreetMap names Beas inside the district (about 92 kilometres of the main river, pulled on 4 November 2026 [10]), projected them to UTM zone 43N, and put every square whose centre lies within 3,000 metres of them in the corridor. The corridor is tested first, then the side-valley areas, then everything else. With a 2 kilometre corridor the share of the growth is 35%, and with 5 kilometres it is 45%; the corridor’s built area grows 1.8 to 1.9 times in all three cases.
Building outlines
Open Buildings v3 gives 204,691 buildings and 1,682.8 hectares at a confidence of 0.70 or more, and 251,500 buildings and 1,838.4 hectares at 0.65 or more [3]. For Microsoft, I used the February 2026 release: 150,429 buildings with their centre inside the district, 1,580.0 hectares [5]. That date is when Microsoft published the release, and I couldn’t find a date for the imagery behind individual buildings. An older copy of Microsoft’s India footprints on Earth Engine gives 1,313.5 hectares. It was last updated in 2022, so I used the 2026 release.
Open Buildings Temporal [4] has one 4-metre image a year, dated 30 June. For each year, I added up the area of pixels whose building-presence score is above 0.5 and above 0.7. The two thresholds are my choice.
Road area
I took road lengths from OpenStreetMap on 2 November 2026 [10] and clipped them to the district. The lengths are: trunk (with trunk links) 200 kilometres, secondary 223, tertiary 358, unclassified 1,537, and residential, service, living street and “road” together 165, which makes 2,483. The 2,490 kilometres in Figure 4 comes from a separate query of the same road classes and differs by less than half a per cent. Footpaths, tracks, steps and similar are left out. The road area includes the roads that the PWD lists as unmetalled, 395 kilometres in March 2026.
The widths I assumed are in the table behind Figure 5, which lists the low, central and high width for each class.
The PWD tables
The PWD overwrites its district table each year [8]. I found Internet Archive captures from 25 November 2020 (data as on 31 October 2020) and 25 December 2024 (data as on 31 March 2024), and I read the live page on 2 November 2026 (data as on 31 March 2026). I found no capture for the years in between. A search result showed a 31 March 2025 value of 2,241 kilometres, which is in the CSV for Figure 4 but not in the 11% calculation.
Distance from the Beas
I measured distance from the centre line of the Beas in OpenStreetMap, about 92 kilometres of the main river inside the district. Distances are horizontal, not height above the river. A building counts if any part of it touches the buffer. Road lengths are clipped to each buffer. The buffers themselves are not clipped to the district boundary.
Data behind the figures
Each figure links to a CSV with the numbers it shows. The CSV for Figure 3 has one row for each 500-metre square that has any built area (6,034 squares), with the position of the square’s centre in UTM zone 43N (EPSG:32643), the built area in 2000 and 2020 in hectares, the named area, and which of the three parts of Table 2 the square falls in.
Sources
- European Commission, Joint Research Centre, Global Human Settlement Layer, GHS-BUILT-S R2023A (built-up surface, 100 m, 1975 to 2020), accessed through Google Earth Engine (JRC/GHSL/P2023A/GHS_BUILT_S) on 2 and 3 November 2026
- ESA WorldCover 10 m land cover, versions 100 (2020) and 200 (2021): https://esa-worldcover.org
- Google Research, Open Buildings v3 polygons, accessed through Google Earth Engine (GOOGLE/Research/open-buildings/v3/polygons) on 3 November 2026
- Google Research, Open Buildings Temporal v1 (4 m, yearly 2016 to 2023), accessed through Google Earth Engine (GOOGLE/Research/open-buildings-temporal/v1) on 2 November 2026
- Microsoft, Global ML Building Footprints, release of 3 February 2026 (github.com/microsoft/globalmlbuildingfootprints), and the earlier India copy in the Earth Engine community catalogue (projects/sat-io/open-datasets/MSBuildings/India)
- German Aerospace Center (DLR), World Settlement Footprint 2015, 10 m (DLR/WSF/WSF2015/v1), accessed through Google Earth Engine
- Copernicus Global Land Service, Land Cover 100 m, collection 3 (2015 to 2019), accessed through Google Earth Engine
- Himachal Pradesh Public Works Department, District wise metalled and unmetalled road density (hppwd.hp.gov.in/district-wise-metalled-and-unmetalled-road-density): live page as on 31 March 2026, retrieved 2 November 2026; earlier versions as on 31 October 2020 and 31 March 2024 from the Internet Archive’s Wayback Machine
- Government of Himachal Pradesh, Road Safety Book 2015-2020, road network by district (roadsafety.hp.gov.in)
- OpenStreetMap contributors, roads (highway tags) and place names inside the Kullu district relation, retrieved through the Overpass API on 2 and 3 November 2026. Data licensed under the Open Database Licence
- Microsoft road detections and Meta road detections for India, accessed through github.com/ramSeraph/indian_transport
- Dipender Manta, “Kullu-Manali road bears brunt of monsoon fury”, Tribune India, 27 July 2023 (tribuneindia.com/news/himachal/kullu-manali-road-bears-brunt-of-monsoon-fury-18725)
- Tribune India, “Kullu residents want Beas channelized” (tribuneindia.com/news/himachal/kullu-residents-want-beas-channelized-531912), 2023
- Negi, R. et al., “The Beas river floods 2023: a watershed moment for paradigm shift towards urbanization and development in the Higher Himalayan valleys”, Current Science, vol. 127, no. 1, July 2024, pp. 65-77 (doi.org/10.18520/cs/v127/i1/65-77)
Cite this post
Please cite this post as:
Malik, A. (2026). Is Kullu building its way out of the valley? amanmalik.net. https://amanmalik.net/projects/kullu-buildings-and-roads/BibTeX:
@online{malik2026kullubuildingsandroads,
  author = {Malik, Aman},
  title  = {Is Kullu building its way out of the valley?},
  year   = {2026},
  url    = {https://amanmalik.net/projects/kullu-buildings-and-roads/}
}
Please also cite the underlying data sources listed above.
Continue reading
More in the series: Kullu land and cover